On 16 November 2026, the Ministry of Statistics and Programme Implementation released the PLFS Monthly Bulletin for October 2026, the nineteenth in the series. For persons aged 15 and above, the unemployment rate stood at 4.9%, down 0.3 percentage points from a year earlier. The labour force participation rate (LFPR) was 55.7%, the worker population ratio (WPR) was 53.0%, and the female LFPR reached 35.0%, its highest since February 2026. Urban unemployment fell to 6.7%. These are the headline numbers for the month, but a student who cannot say what each ratio is divided by will lose marks on them. CDS 2026-II asked exactly that: given an LFPR of 50% and a WPR of 45%, find the unemployment rate.
From Five-Yearly Rounds to a Monthly Bulletin
By Hitendra Deswal · Economics faculty, The Cavalier
For decades, India's jobs data came from the National Sample Survey Organisation (NSSO), whose Employment and Unemployment Surveys (EUS) ran once every five years from 1972-73. The big rounds of this kind were the 61st (2004-05), the 66th (2009-10) and the 68th (2011-12). Five years is too long to wait for labour-market news, so on the advice of the National Statistical Commission the Periodic Labour Force Survey (PLFS) was introduced in 2017. It is run by the National Statistics Office (NSO), which absorbed NSSO, under MoSPI, and its headline rates cover persons aged 15 and above. The first annual report covered 2017-18 and came out in May 2019.
| Feature | Old EUS (quinquennial) | PLFS |
|---|---|---|
| Frequency | Once in five years | Annual reports from 2017-18, with quarterly urban bulletins; monthly all-India estimates from January 2025 |
| Method | Without these features | Computer-assisted interviews (CAPI) with built-in checks; urban households revisited in a rotational panel; hours worked recorded |
| Reference concept | Usual status, weekly status and daily status | Annual reports: usual status and CWS. Monthly bulletin: CWS only |
From January 2025 the design was strengthened to give monthly estimates at all-India level, quarterly estimates for rural and urban areas separately, and annual estimates. The first monthly bulletin was for April 2025. Definitions did not change. They still follow the Dantwala Committee and the standards of the International Conference of Labour Statisticians, so long-run comparisons remain valid. The October 2026 estimates rest on 3,70,475 persons surveyed, of whom 2,11,474 were in rural and 1,59,001 in urban areas. Our daily article on the July to September 2026 quarterly bulletin shows the same data over a quarter.
Three Clocks: Usual, Weekly and Daily Status
A person who works three months a year, or three days a week, is employed by one yardstick and unemployed by another. Surveys therefore fix a reference period and a rule. There are four standard approaches.
| Approach | Reference period | Who counts as employed |
|---|---|---|
| Usual Principal Status (UPS) | Past 365 days | The activity on which the person spent the major part of the year (more than half of it) |
| Usual Principal and Subsidiary Status (UPSS) | Past 365 days | UPS, plus anyone who did some subsidiary work for at least 30 days |
| Current Weekly Status (CWS) | The past 7 days | Anyone who worked at least one hour on at least one day that week |
| Current Daily Status (CDS) | Each day of the past week | Counted in person-days, not persons |
Under CWS, a person who did no work at all is unemployed if he or she sought work, or was available for it, for at least an hour on some day of the week. Someone who neither worked nor looked is outside the labour force. Because anyone with a job gets first priority, a person who sold vegetables for an hour and looked for a factory job the rest of the week is counted as employed.
The longer the window, the lower the unemployment rate. A year-long window forgives gaps between jobs, while a single day does not. The older NSSO rounds show this clearly.
| Unemployment rate (%) | 2004-05 | 2009-10 |
|---|---|---|
| UPSS (one year) | 2.3 | 2.0 |
| CWS (one week) | 4.4 | 3.6 |
| CDS (each day) | 8.2 | 6.6 |
The monthly bulletin uses CWS. The annual PLFS headline often uses usual status. They measure different things, so never set one beside the other. For example, the Economic Survey reports that female LFPR rose from 23.3% in 2017-18 to 41.7% in 2023-24 (annual, usual status), while the October 2026 monthly figure is 35.0% (weekly status). The lower number is not a collapse. It is a stricter window.
LFPR, WPR and the Unemployment Rate
Everyone aged 15 or above is placed in exactly one of three groups. That is the entire logic of the survey, and the figure below shows it.
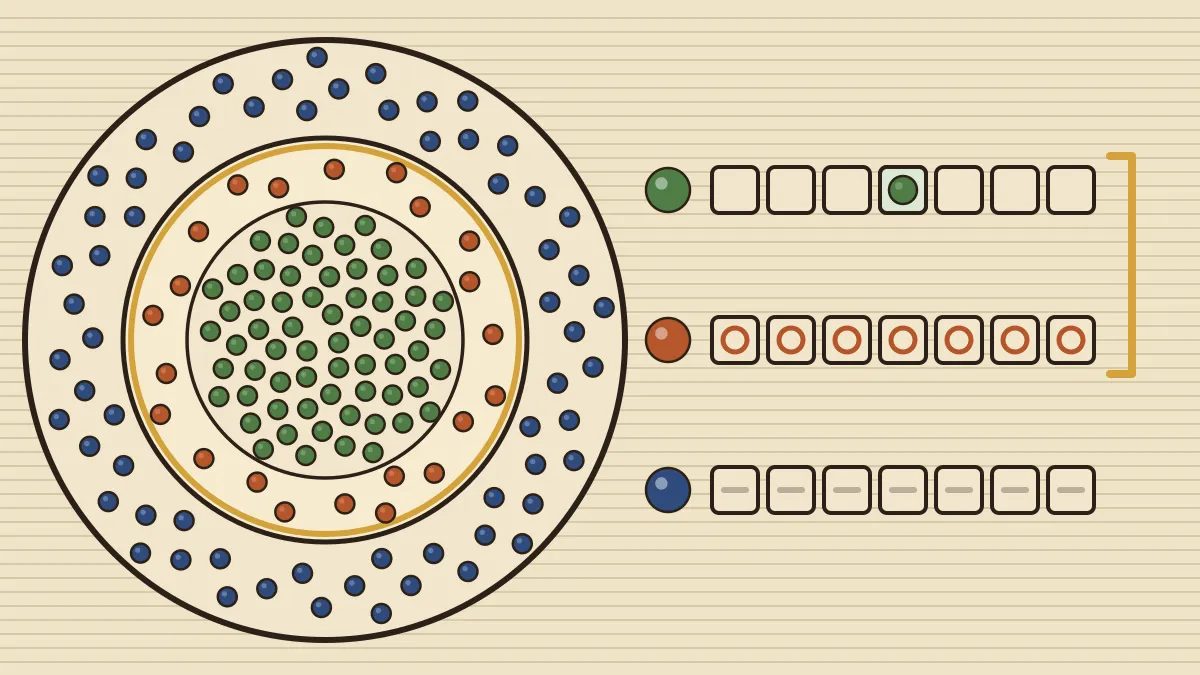
- Employed: working, at least an hour in the reference week (CWS).
- Unemployed: not working, but seeking or available for work.
- Outside the labour force: students, people in domestic duties, pensioners, the infirm, and those who are not available for work. A person who has given up looking, a "discouraged worker", also lands here, which is why the unemployment rate can fall without a single new job.
| Ratio | Formula | Divide by |
|---|---|---|
| Labour force | Employed + unemployed | (a count, not a ratio) |
| LFPR | (Employed + unemployed) ÷ population aged 15+ × 100 | The whole 15+ population |
| WPR | Employed ÷ population aged 15+ × 100 | The whole 15+ population |
| Unemployment rate (UR) | Unemployed ÷ labour force × 100 | The labour force only |
In a district, 2,000 persons are aged 15 or above. Of them, 1,045 are working, 55 are seeking work, and 900 are outside the labour force. Find LFPR, WPR and UR.
The shortcut makes the CDS 2026-II question a one-line job: UR = (50 − 45) ÷ 50 × 100 = 10%. The wrong answer (5%) comes from dividing by the population instead of the labour force. The October 2026 bulletin obeys the same identity: (55.7 − 53.0) ÷ 55.7 × 100 ≈ 4.9%.
Reading the October 2026 Bulletin
All figures below are for persons aged 15 and above, on CWS.
| Indicator (%) | Oct 2026 | Sep 2026 | Oct 2025 |
|---|---|---|---|
| LFPR, all | 55.7 | 55.5 | 55.4 |
| LFPR, rural / urban | 58.4 / 50.5 | 58.0 / 50.7 | 57.8 / 50.5 |
| Female LFPR | 35.0 | 34.6 | 34.2 |
| WPR, all | 53.0 | 52.7 | 52.5 |
| Unemployment rate, all | 4.9 | 5.0 | 5.2 |
| UR, rural / urban | 4.2 / 6.7 | 4.2 / 6.9 | 4.4 / 7.0 |
| Female UR, all | 5.0 | 5.2 | 5.4 |
| Female UR, rural / urban | 3.8 / 8.7 | 3.9 / 9.2 | 4.0 / 9.7 |
Three readings stand out. First, rural women drive the participation story: rural female LFPR reached 39.5%, against 25.9% for urban women. Second, urban unemployment is higher than rural (6.7% against 4.2%), and urban women face the highest rate of all (8.7%). Rural work is often self-employment or farm work, which counts as work even when income is low, while urban job-seekers tend to wait for regular jobs. Third, the male WPR is about 73.7%, while female WPR is 33.3%.
The unemployment rate says nothing about the quality of work. An hour of paid or self-employed work counts, so a low UR can sit alongside low earnings. That is why analysts also read the share of regular-wage jobs, hours worked and underemployment. Official gaps in women's work have a known cause. The Time Use Survey 2024, quoted in the Economic Survey, found that 41% of women aged 15-59 provide unpaid care to household members, against 21.4% of men. Unpaid care is not counted as employment in these ratios. NSO surveys also feed poverty estimates, as our page on poverty and development explains. The NSO has also published a district-level labour market snapshot from PLFS data.
Which Kind of Unemployment Is It?
The PLFS counts open unemployment: people without work who are looking for it. The classical types describe why a person is without work, and the full treatment is on our page on unemployment and the labour force. In brief:
| Type | Meaning | Example |
|---|---|---|
| Frictional | Time spent moving between jobs | A graduate searching for a first job |
| Structural | Skills do not match the vacancies, or technology changes the economy | Typists after computers |
| Cyclical | Recession lowers demand for labour | Layoffs in a slowdown |
| Seasonal | Work available only part of the year | Farm labour between harvests, tourism off-season |
| Disguised | More workers than the job needs, so removing some does not reduce output | Surplus family members on a small farm |
| Underemployment | Working, but below one's hours or skills | An engineer driving a taxi |
The natural rate is frictional plus structural unemployment, and the idea is credited to Milton Friedman. Note which types the survey misses: disguised unemployment and underemployment are hidden, because those people say they are working.
Other labour data sources. e-Shram was launched by the Labour Ministry on 26 August 2021 as a national database of unorganised workers. The Economic Survey reports more than 31 crore registrations by January 2026, with women at 54%. It is a registry, not a survey, so it cannot give an unemployment rate (see e-Shram at five). MoSPI also runs the Annual Survey of Unincorporated Sector Enterprises (ASUSE), which looks at small non-farm businesses, and it compiles the price indices on our CPI, WPI and IIP page.
How UPSC Has Asked It: Past Papers Solved
UPSC asks for formula arithmetic, which ministry does what and type of unemployment. Each question below was checked against the definitions above.
If Labour Force Participation Rate (LFPR) is 50% and Worker Population Ratio (WPR) is 45%, what is the Unemployment Rate?
(a) 5% (b) 10% (c) 15% (d) Cannot be determined
Answer: (b). UR = (50 − 45) ÷ 50 × 100 = 10%. The tempting (a) divides the 5-point gap by the whole population.
Consider the following statements regarding Annual Periodic Labour Force Survey (PLFS) report 2023-24 by the National Statistical Organization (NSO): 1. The agriculture sector remains dominant in employment, with its share rising from about 44 per cent in 2017-18 to about 46 per cent in 2023-24. 2. The share of female workers in agriculture has increased during the period 2017-18 to 2023-24.
(a) 1 only (b) 2 only (c) Both 1 and 2 (d) Neither 1 nor 2
Answer: (c). The Economic Survey puts agriculture's share of the workforce at 46.1%, and official commentary links the rise in women's participation to rural women joining agriculture. Both statements fit UPSC's key.
Which of the following surveys are being conducted by the Ministry of Statistics and Programme Implementation, Government of India? 1. Survey on Social Consumption — Health 2. Comprehensive Modular Survey — Telecom and ICT skills 3. Periodic Labour Force Survey 4. Annual Survey on Unincorporated Enterprises
(a) 1, 2, 3 and 4 (b) 1, 2 and 3 only (c) 3 and 4 only (d) 1 and 2 only
Answer: (a). All four are MoSPI surveys through the NSO. PLFS and ASUSE are the labour and enterprise surveys.
The mismatch in the regional or occupational pattern of job vacancies and the pattern of worker availability results in
(a) Structural unemployment (b) Disguised unemployment (c) Altered unemployment (d) Cyclical unemployment
Answer: (a). A mismatch of skills or location between workers and vacancies is structural. Disguised means too many workers for the work, and "altered" is not a type.
The natural rate of unemployment hypothesis was advocated by
(a) Milton Friedman (b) A. W. Phillips (c) J. M. Keynes (d) R. G. Lipsey
Answer: (a). Friedman (1968) argued that unemployment settles at a natural rate set by frictional and structural factors. Phillips and Lipsey are linked with the Phillips curve.
Which one among the following statements is not correct?
(a) When the economy grows slower than its potential, the unemployment rate rises. (b) Structural employment occurs when jobs are eliminated by changes in demand for particular goods or due to automation. (c) Recession in the economy leads to cyclical unemployment. (d) At full employment, the measured unemployment rate is negative.
Answer: (d). A rate cannot be negative. At full employment only frictional and structural unemployment remain, so the measured rate equals the natural rate, which is above zero. Statement (b) writes "employment" where "unemployment" is meant, but it gives the standard definition of structural unemployment, so it is not the false one.
Learn the denominators: LFPR and WPR divide by population; UR divides by labour force. Then learn the one-line meaning of each status (UPSS = one year, CWS = one week, CDS = each day) and the five types of unemployment.
Practice MCQs (with answers)
- The unemployment rate is defined as
- unemployed persons ÷ total population
- unemployed persons ÷ employed persons
- unemployed persons ÷ persons outside the labour force
- unemployed persons ÷ labour force
- Under the Current Weekly Status approach, a person is counted as employed if he or she worked
- at least one hour on at least one day of the previous seven days
- at least four hours on every day of the week
- for more than 183 days
- for at least 30 days
- Out of 2,000 persons aged 15 and above, 1,100 are in the labour force and 1,045 have work. The unemployment rate is
- 2.75%
- 5.25%
- 5%
- 55%
- Which approach uses a reference period of one year?
- Current Weekly Status
- Usual Principal and Subsidiary Status
- Current Daily Status
- The monthly PLFS bulletin
- The Periodic Labour Force Survey was introduced in
- 2011
- 2017
- 2019
- 2025
- If LFPR is 60% and WPR is 57%, the unemployment rate is
- 3%
- 4%
- 6%
- 5%
- A student preparing full-time for an examination and not looking for work is classified as
- outside the labour force
- unemployed
- employed
- underemployed
- Which of the following is a registry of workers and NOT a sample survey?
- PLFS
- ASUSE
- e-Shram
- Time Use Survey
1-d, 2-a, 3-c, 4-b, 5-b, 6-d, 7-a, 8-c. Q3: unemployed = 1,100 − 1,045 = 55, and 55 ÷ 1,100 = 5%. Dividing by 2,000 gives 2.75%, the usual trap. Q5: the PLFS began in 2017, its first annual report came in 2019, and monthly estimates started in 2025. Q6: (60 − 57) ÷ 60 = 5%. Q8: e-Shram counts people who register themselves, while the other three are surveys.
Quick Revision
- NSSO's quinquennial EUS (from 1972-73; last big round 2011-12) → PLFS 2017 (NSO, MoSPI). Age 15+. Monthly all-India estimates from January 2025; October 2026 is the 19th bulletin.
- UPS/UPSS = 365 days (UPSS adds subsidiary work of 30+ days). CWS = 7 days, one hour on one day is enough. CDS = each day, person-days. Monthly bulletin = CWS.
- Longer window, lower rate: UR(UPSS) < UR(CWS) < UR(CDS). Do not compare CWS with usual status.
- LFPR = (E + U) ÷ population 15+. WPR = E ÷ population 15+. UR = U ÷ labour force = (LFPR − WPR) ÷ LFPR.
- Oct 2026: LFPR 55.7, WPR 53.0, UR 4.9, female LFPR 35.0, urban UR 6.7, rural female UR 3.8.
- Female LFPR (usual status): 23.3% (2017-18) → 41.7% (2023-24). Unpaid care is not counted: TUS 2024, 41% of women vs 21.4% of men.
- Types: frictional, structural, cyclical, seasonal, disguised, underemployment. Natural rate = frictional + structural (Friedman). Surveys miss disguised unemployment.
- e-Shram: registry, launched 26 August 2021, over 31 crore (Jan 2026). ASUSE: survey of unincorporated enterprises.
Frequently asked questions
What does the PLFS measure?
The Periodic Labour Force Survey, run by the National Statistics Office under MoSPI, measures employment, unemployment and participation in the workforce. Its main indicators are the labour force participation rate, the worker population ratio and the unemployment rate, published as monthly, quarterly and annual estimates.
What is the difference between CWS and usual status?
Usual status looks at what a person did over the past 365 days and classes them by the main activity (plus subsidiary work of at least 30 days in UPSS). Current weekly status looks only at the past seven days, and one hour of work on any day is enough to count as employed. The monthly PLFS bulletin uses CWS, so its figures should not be compared with annual usual-status figures.
How are LFPR, WPR and the unemployment rate related?
LFPR and WPR are both divided by the population aged 15 and above, while the unemployment rate is divided by the labour force. That gives the shortcut UR = (LFPR minus WPR) divided by LFPR, times 100. With an LFPR of 50% and a WPR of 45%, the unemployment rate is 10%.
Why can the unemployment rate fall without new jobs?
The rate counts only people who are in the labour force. If some job-seekers give up and stop looking, they move outside the labour force, so the numerator shrinks even though no job was created. That is why participation and worker population ratios are read alongside the unemployment rate.
What were the headline numbers in the October 2026 PLFS bulletin?
For persons aged 15 and above on the current weekly status basis, the unemployment rate was 4.9%, LFPR 55.7%, WPR 53.0% and female LFPR 35.0%. Urban unemployment was 6.7% and rural 4.2%. It was the nineteenth monthly bulletin, released on 16 November 2026.
Related CDS / OTA Economics topics
Economy questions reward clean definitions
Cavalier's CDS/OTA batches teach economy through formulas, worked numbers and weekly PYQ tests, so ratios like LFPR and WPR never trip you up.